Market Commentary – May 2026
This post was originally published on this site.
as of 05.31.2026
- Equities enjoyed strong gains in May despite the on-going conflict with Iran. Much of the advance was driven by AI-related companies such as chip manufacturers (particularly those in the memory category) and providers of hardware such as servers.
- After surpassing the 7,000 milestone for the first time ever in April, the S&P 500 gained another 5.26%. The Technology sector gained an impressive 15.99% after its 17.47% gain the previous month.
- With first quarter earnings season now largely behind us, the results were exceptional. Earnings per share growth is tracking +18% year-over-year in 1Q26. These results are causing some analysts to upwardly revise their full year earnings forecasts. A core group of 17 AI-focused companies contributed approximately half of the entire S&P 500 earnings growth.
- Apple, Inc., Micron Technology, Inc. and Microsoft Corporation were the top three contributors to return for the S&P 500 in May whereas Walmart, Inc., Alphabet, Inc., and JPMorganChase & Co. were the biggest detractors.
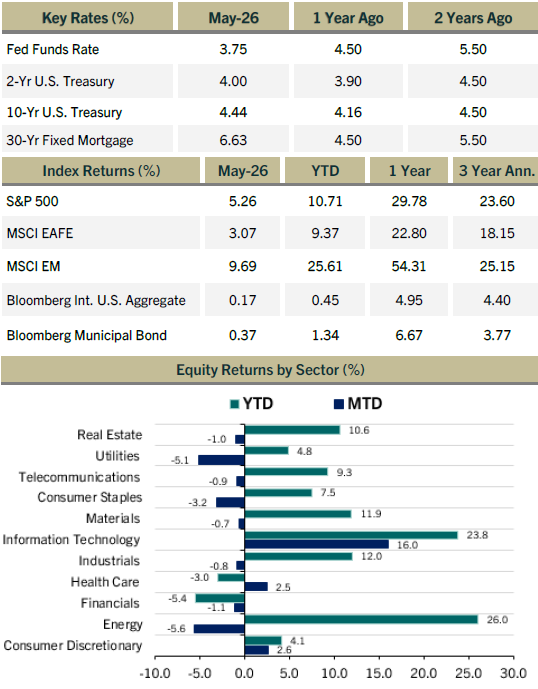
- Oil prices tumbled by 17% in May over optimism that a deal would be reached with Iran in a matter of days, but a deal remains elusive as of this writing. The decline in oil led to a slide in the Energy sector of the index, which was down by 5.5%.
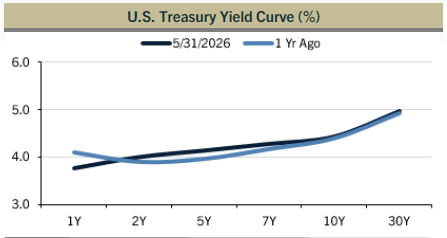
- The U.S. Intermediate Agg bond index rose 17bps, the same as the prior month, while the Municipal Bond index returned 37bps. These returns reveal that interest rates changed very little for the month, although this masks some of the intra-month volatility that saw rates briefly shift higher.
- The main reason for higher interest rates compared to pre-conflict is the threat of higher inflation due to the blockage of the Strait of Hormuz. While energy supply risks dominate the headlines, similar pressures are affecting industries ranging from agriculture and chemicals to semiconductors.
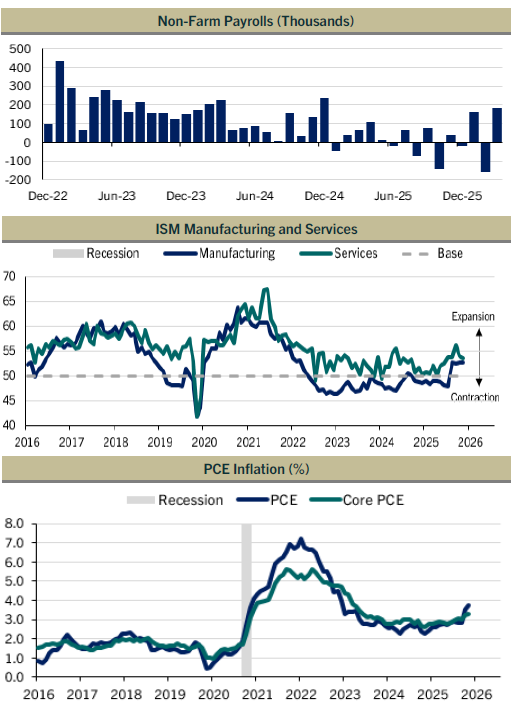
- The Producer Price Index (PPI) for April demonstrates some of this price pressure. The index was up by 1.4% for the month, or 6% on a year-over-year basis.
- Other economic data revealed mostly steady conditions for the broad economy, albeit skewed by the booming AI-related infrastructure build-out. Explosive growth of data center investment spending is permeating across the economy. Higher spending for defense and aircraft also drove the latest durable goods report. Many are expecting the consumer segment to slow its spending as higher prices erode spending power, particularly for the low income consumer.
- Manufacturing activity remained in expansion territory in May (ISM 54.0%), but only 25% of the comments were positive vs. 69% negative. The Iran war was mentioned in 42% and tariffs (remember those?) in 18%, while 57% mentioned pricing volatility as an issue for their companies. Needless to say, this is a challenging operating environment for a large contingent of the business community.
- Kevin Warsh was formally sworn-in as the new Chairman of the Federal Reserve, replacing Jerome Powell. Rather than resigning his seat as a Governor, Powell is remaining on the Board indefinitely pending final resolution of the legal proceedings against him. Separately, Lisa Cook’s attempted firing from the Board is also awaiting a final decision at the Supreme Court. Suffice it to say that increased scrutiny will be on the Fed this summer due to all this drama, rare for the staid Federal Reserve.
- When the Fed’s FOMC does meet again, on June 17, it will be Warsh’s first meeting as presiding Chair. Due to the recent higher inflation reports, the Fed is expected to shift to a neutral posture, meaning it is neither likely to lower nor raise rates in the near term. Market indicators are beginning to reflect a greater likelihood of a rate hike as the next move, perhaps later this year.
Index Definitions
The S&P 500 (S&P 500) Total Return is a market capitalization-weighted index composed of the 500 most widely held stocks whose assets and/or revenues are based in the US; it’s often used as a proxy for the U.S. stock market. TR (Total Return) indexes include daily reinvestment of dividends.
MSCI EAFE Total Return Net is the Morgan Stanley Capital International Europe, Australia, and Far East index that is a market-capitalization-weighted index of 21 non-U.S. industrialized country indexes. The index includes net dividends reinvested minus-tax-credit calculations, but subtracts withholding taxes retained at the source for foreigners who do not benefit from a double taxation treaty.
The MSCI Emerging Markets (MSCI EM) Index captures large and mid cap representation across 27 Emerging Markets (EM) countries.
Bloomberg Municipal Bond Index Total Return Index Value Unhedged USD (Municipal Bond Index) covers the US-denominated long-term tax exempt bond market. The index has four main sectors: state and local general obligation bonds, revenue bonds, insured bonds and prerefunded bonds.
The Bloomberg Intermediate U.S. Aggregate Bond Index is a broad-based flagship benchmark that measures the performance of investment grade, U.S. dollar-denominated, fixed-rate taxable bond market with less than 10 years to maturity. The securitized sector includes Treasuries, government-related and corporate securities, MBS (agency fixed-rate and hybrid ARM pass-throughs), ABS, and CMBS.
The federal funds rate is the interest rate at which depository institutions trade federal funds (balances held at Federal Reserve Banks) with each other overnight. When a depository institution has surplus balances in its reserve account, it lends to other banks in need of larger balances. In simpler terms, a bank with excess cash, which is often referred to as liquidity, will lend to another bank that needs to quickly raise liquidity. (1) The rate that the borrowing institution pays to the lending institution is determined between the two banks; the weighted average rate for all of these types of negotiations is called the effective federal funds rate.(2) The effective federal funds rate is essentially determined by the market but is influenced by the Federal Reserve through open market operations to reach the federal funds rate target. All Key Rates and Returns by Index are quoted out of Bloomberg.
The CPI Index represents changes in prices of all goods and services purchases for consumption by urban households. Retail Gas Prices are provided by AAA using data from up to 120,000 retail stations. West Texas Intermediate (WTI) crude oil is a specific grade of crude oil and one of the main three benchmarks in oil pricing, along with Brent and Dubai Crude.
Equity Returns by Sector are based on the GICS methodology. Return data are calculated by Bloomberg using constituents and weights as provided by Standard & Poor’s. Returns are cumulative total return for stated period, including reinvestment of dividends.
Chart Definitions
The Services and Manufacturing PMI from the Institute for Supply Management (ISM) is a composite index based on the diffusion indexes for four of the indicators with equal weights: Business Activity (seasonally adjusted), New Orders (seasonally adjusted), Employment (seasonally adjusted) and Supplier Deliveries. The Manufacturing PMI is a composite index based on the diffusion indexes of five of the indexes with equal weights: New Orders (seasonally adjusted), Production (seasonally adjusted), Employment (seasonally adjusted), Supplier Deliveries, and Inventories (seasonally adjusted). Diffusion indexes have the properties of leading indicators and are convenient summary measures showing the prevailing direction of change and the scope of change. An index reading above 50 percent indicates that the services economy is generally expanding; below 50 percent indicates that it is generally declining. Supplier Deliveries is an exception. A Supplier Deliveries Index above 50 percent indicates slower deliveries and below 50 percent indicates faster deliveries.
The PCE Price Index Excluding Food and Energy, also known as the core PCE price index, is released as part of the monthly Personal Income and Outlays report. The core index makes it easier to see the underlying inflation trend by excluding two categories – food and energy – where prices tend to swing up and down more dramatically and more often than other prices. The core PCE price index is closely watched by the Federal Reserve as it conducts monetary policy. The PCE price index, released each month in the Personal Income and Outlays report, reflects changes in the prices of goods and services purchased by consumers in the United States. Quarterly and annual data are included in the GDP release.
Total Nonfarm, commonly known as Total Nonfarm Payroll, is a measure of the number of U.S. workers in the economy that excludes proprietors, private household employees, unpaid volunteers, farm employees, and the unincorporated self-employed. This measure accounts for approximately 80 percent of the workers who contribute to Gross Domestic Product (GDP).
The diffusion non-farm payrolls chart are based on the percent of industries with employment increasing plus one-half the industries unchanged employment, where 50% indicates an equal balance between industries with increasing and decreasing employment.
Disclaimer
This document is a general communication being provided for informational purposes only. It is educational in nature and not designed to be taken as advice or a recommendation for any specific investment product, strategy, plan feature or other purpose in any jurisdiction. This material does not contain sufficient information to support an investment decision and it should not be relied upon by you in evaluating the merits of investing in any securities or products. In addition, users should make an independent assessment of the legal, regulatory, tax, credit, and accounting implications and determine, together with their own financial professional, if any investment mentioned herein is believed to be appropriate to their financial situation and investment profile. Investors should ensure that they obtain all available relevant information before making any investment. It should be noted that investments involve risks, the value of investments and the income from them may fluctuate in accordance with market conditions and taxation agreements and investors may not get back the full amount invested. Both past performance and yields are not reliable indicators of current and future results. All information presented herein is considered to be accurate at the time of production, but no warranty of accuracy is given and no liability in respect of any error or omission is accepted.
Past performance does not guarantee future results. Diversification does not guarantee investment returns and does not eliminate the risk of loss.
www.maplecapital.com | 535 Stone Cutters Way, Montpelier, VT 05602 | Toll Free: 800.255.9946
The post Market Commentary – May 2026 appeared first on Maple Capital Management.